
Lately my home router ASUS AX-68U with Asuswrt-Merlin firmware has been using much more CPU than it used to do. It's not being slow or anything, but I'm curious how its CPU usage jumped since I last updated the firmware. This kind of jump in CPU usage cannot be a coincidence and definitely something that I want to track down. Below is a graph from my home Zabbix dashboard.

Let's monitor some processes
As my router already runs Zabbix agent, monitoring the running processes is just a matter of adding the processes by Zabbix agent template to my home router host.

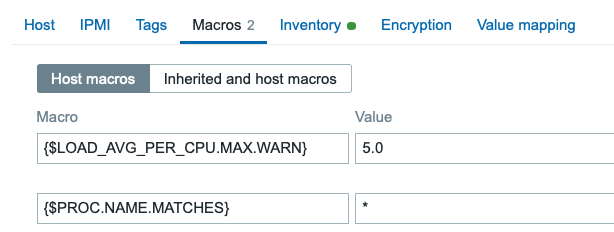
Then on Macros tab I made it match all the processes. Note that this might not be the cleverest idea in a bigger environment as you would then receive LOTS of items, but can be ok for an experiment like this.
See the results
After this, we have some results to marvel. Here is the tag level view of my home router latest data for the processes.

If I click on any of them, I get these details.

But combing the results like this would be lots of work, so that's why we have our almight graphs and widgets. One way would be these traditional time-series graphs:
... or recent Honeycomb widgets ..
ECharts are go!
... but I'd like to take a moment to showcase monZphere's excellent ECharts widget. It's open-source, it's free, it's fast, it looks gorgeous.
It can do for example horizontal bars:

... or treemaps ..
... or maybe the best in this particular case, these ad-hoc sortable, paginated tables which are pure joy to use.

What did I learn from these?
Well, I did not monitor the individual processes before this CPU usage spike started to happen, so I do not know the previous status for sure. However, looking at all the numbers, I suspect that something is wonky with my AdGuard Home installation -- it's an ad-blocker module for Asuswrt-Merlin, among others -- so maybe reinstalling it will resolve this. That's a story for another time.

Comments (2)
Question
The only (not verified)
Wait, by default Zabbix doesn’t monitor all processes running on a host ? How does it know if a process is consuming all resources then ???
No, it does not
whatsuphome
It does not. If you think of it, in really big environments it would be huge strain for any monitoring system to keep an eye on ALL the processes all the time. If you have for example 10k servers with 1k processes on each, that alone would equal ten million items on Zabbix. Or, in fact, many more than that, as there would be individual items for CPU, memory usage, other aspects of a process.
More rational approach is to use the processes template on servers where it's likely that some process goes bonkers, and then monitor only that process or a much smaller set of processes.
How do you or Zabbix then know that a process is consuming all the resources? Well, if the load average, CPU usage, memory usage, other values start to balloon fast, then it's time for an admin to jump in and see what's going on.