Skip to header Skip to main navigation Skip to main content Skip to footer

Search form

Site branding

What's up, home?
Monitor everything with Zabbix & Grafana

Main navigation

  • Home
  • Story mode
  • About
  • Features
  • Hardware list
  • Videos
  • GitHub (opens in new tab)
  • Daily AI generated stories (opens in new tab)

accesslogs

Breadcrumbs

Breadcrumb

  • Home
  • accesslogs

Main page content

Part 34: Monitor your website visitor rate
By whatsuphome | 6:15 AM EET, Thu January 26, 2023
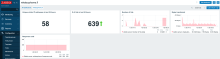
Dashboard

Can you monitor your website visitor rate with Zabbix? Of course you can! By day, I am a lead site reliability engineer in a global cyber security company. By night, I monitor my home with Zabbix & Grafana and do some weird experiments with them.
whatsuphome
zabbix
website
accesslogs
part34
  • Read more about Part 34: Monitor your website visitor rate
  • 2 comments
  • Add new comment

Development news: whatsuphome.fi access logs now analyzed in real time by Zabbix

By whatsuphome | 8:15 AM EET, Mon January 16, 2023
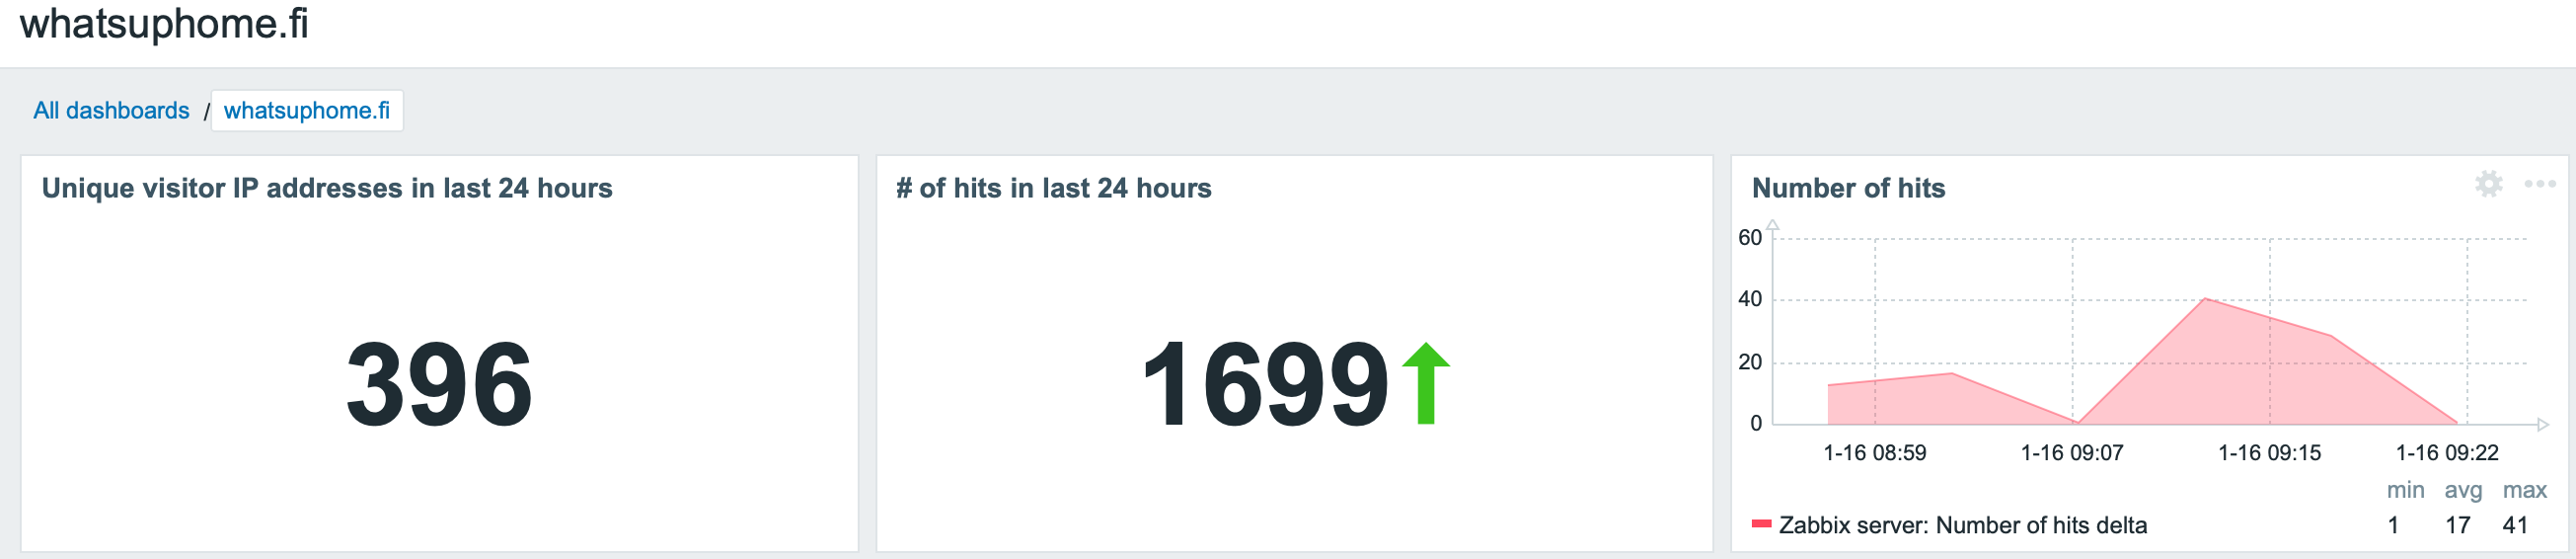
Screenshot of access logs analytics
Access logs for this site are now analysed in real time by my home Zabbix. How did I do this (and more)? Check back when I release Part 34. Stay tuned!


whatsuphome
developmentnews
zabbix
analytics
accesslogs
webmonitoring
  • Read more about Development news: whatsuphome.fi access logs now analyzed in real time by Zabbix
  • Add new comment
Subscribe to accesslogs

Search

Who am I?

  • Janne Pikkarainen from Finland 🇫🇮
  • Principal Site Reliability Engineer at Forcepoint
  • A Zabbix Summit speaker every year since 2022
  • Walking, talking Zabbix commercial

Support my project

Buy me a coffee 

Footer menu

  • Contact

What's up, home? | Janne Pikkarainen | contact(at)whatsuphome.fi | 2022 - 2026

Developed and Designed by Janne Pikkarainen
