Do you know how often your system is attacked, or what the attackers would do if they could actually ssh into your systems?
Cowrie is a funny little ssh/telnet honeypot. It can work in several different modes, but basically it emulates a Linux/Unix shell, capturing everything that an attacker attempted to do. However, none of the commands that attacker thinks they are running are real; the output mimics actual shell, and you can configure it to respond more. You can use static responses or even hook Cowrie with an LLM to come up with responses in bit laggy real-time.
If I login to my Cowrie instance, on surface things look pretty usual: However, none of this is real.
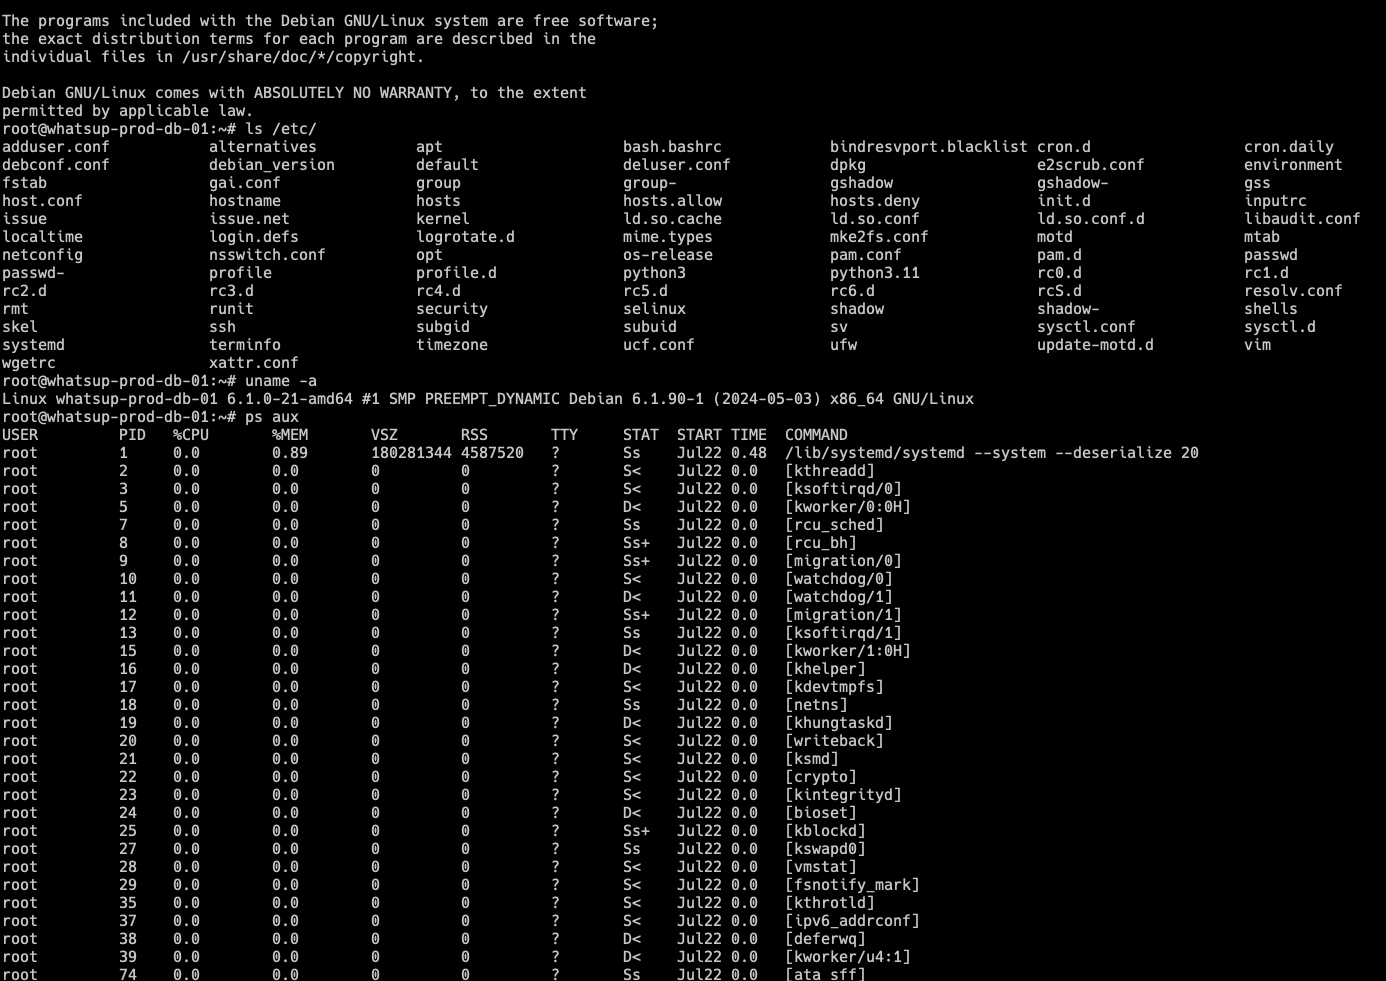
The thing then logs the sessions for example in JSON or plain text formats, or it can push data to Elasticsearch or many different IP reputation services. Here's a snippet of the log I got from my above example when watching the logs of the host machine:
{"eventid":"cowrie.command.input","input":"ls /etc/","message":"CMD: ls /etc/","sensor":"justchoking","uuid":"93a4e046-65ca-11f1-8c96-e45f018b900e","timestamp":"2026-06-15T22:35:38.307938+0300","src_ip":"185.218.xxx.xxx","session":"63daae272140","protocol":"ssh"}
{"eventid":"cowrie.command.input","input":"uname -a","message":"CMD: uname -a","sensor":"justchoking","uuid":"93a4e046-65ca-11f1-8c96-e45f018b900e","timestamp":"2026-06-15T22:35:41.654335+0300","src_ip":"185.218.xxx.xxx","session":"63daae272140","protocol":"ssh"}
{"eventid":"cowrie.command.input","input":"ps aux","message":"CMD: ps aux","sensor":"justchoking","uuid":"93a4e046-65ca-11f1-8c96-e45f018b900e","timestamp":"2026-06-15T22:35:46.423676+0300","src_ip":"185.218.xxx.xxx","session":"63daae272140","protocol":"ssh"}
{"eventid":"cowrie.log.closed","ttylog":"var/lib/cowrie/tty/8b753ea755064f832d09c1dbb13f3e16d3f4cb8ec1e49b69613f41010a7f60e8","size":11993,"shasum":"8b753ea755064f832d09c1dbb13f3e16d3f4cb8ec1e49b69613f41010a7f60e8","duplicate":false,"duration":"106.2","message":"Closing TTY Log: var/lib/cowrie/tty/8b753ea755064f832d09c1dbb13f3e16d3f4cb8ec1e49b69613f41010a7f60e8 after 106.2 seconds","sensor":"justchoking","uuid":"93a4e046-65ca-11f1-8c96-e45f018b900e","timestamp":"2026-06-15T22:37:11.306305+0300","src_ip":"185.218.xxx.xxx","session":"63daae272140","protocol":"ssh"}
{"eventid":"cowrie.session.closed","duration":"107.8","message":"Connection lost after 107.8 seconds","sensor":"justchoking","uuid":"93a4e046-65ca-11f1-8c96-e45f018b900e","timestamp":"2026-06-15T22:37:11.328914+0300","src_ip":"185.218.xxx.xxx","session":"63daae272140","protocol":"ssh"}
As always, I wanted to monitor all this with Zabbix to see what happens within my little honeypot. Quite a lot, I would say.
Setting up Cowrie
Please refer to Cowrie installation if you are interested to try out yourself. You can install it via Docker or PyPI. I created a dedicated cowrie user for which I installed the PyPI version to make Zabbix agent integration then super trivial.
Setting up Zabbix template
My Zabbix agent is reading Cowrie JSON log files and Zabbix then parses those with standard item pre-processing. As "everybody" now uses AI, so did I for this template, too.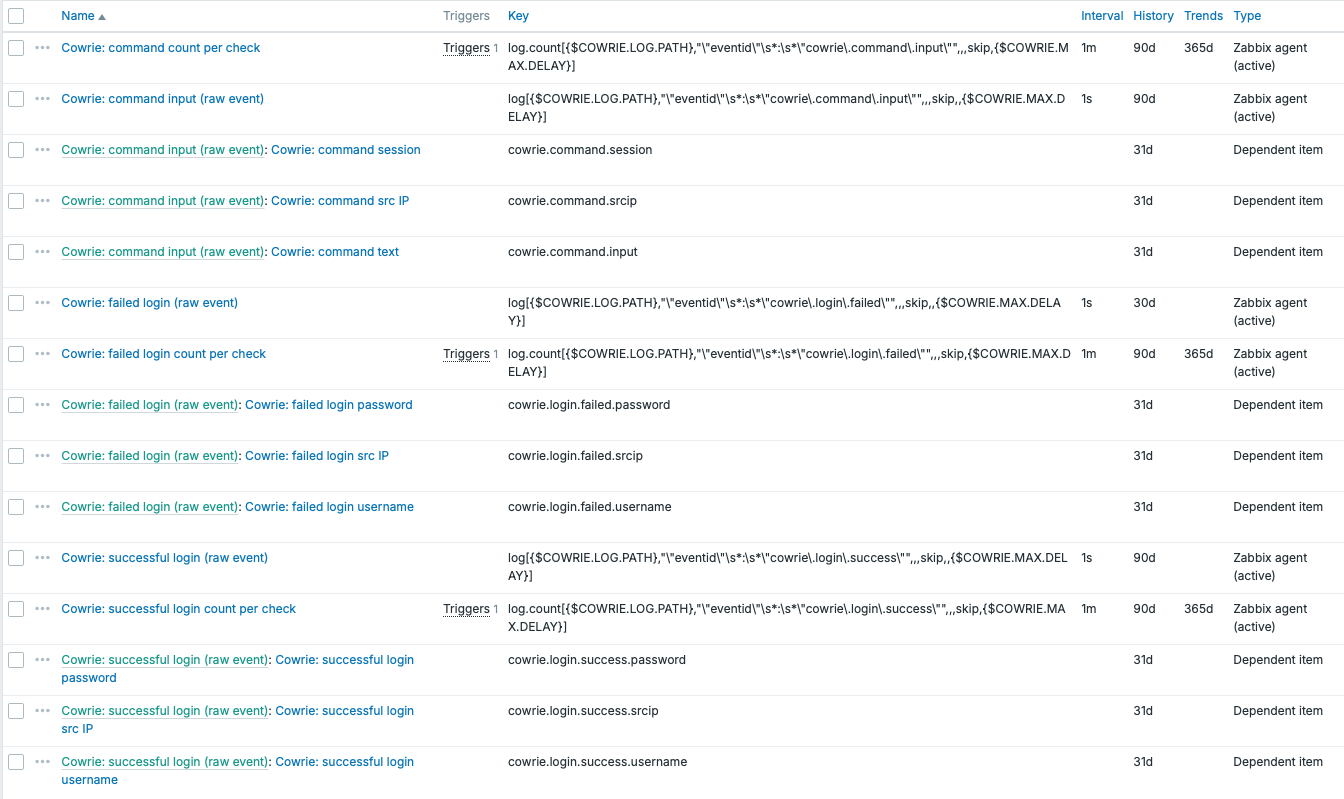
On dependent item, item preprocessing just picks the appropriate JSONPath snippet.
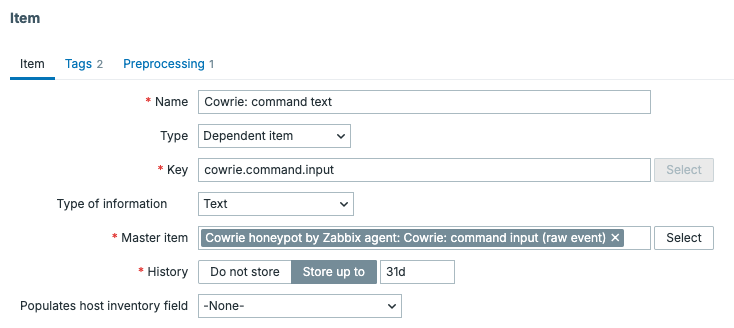
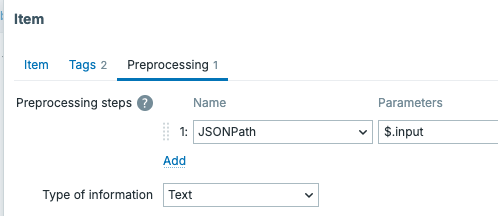
With this template, I get
- Attacker IP
- Successful and failed login attempts
- Usernames and passwords that were attempted
- Commands that were run during the session
Example dashboard
Data like this would not do any good if I would not have a dashboard for it. Well, here goes! As you can see, the attacks are constant, silent moments are very rare. Of course, for this case, I absolutely needed to use Zabbix built-in honeycomb widget,
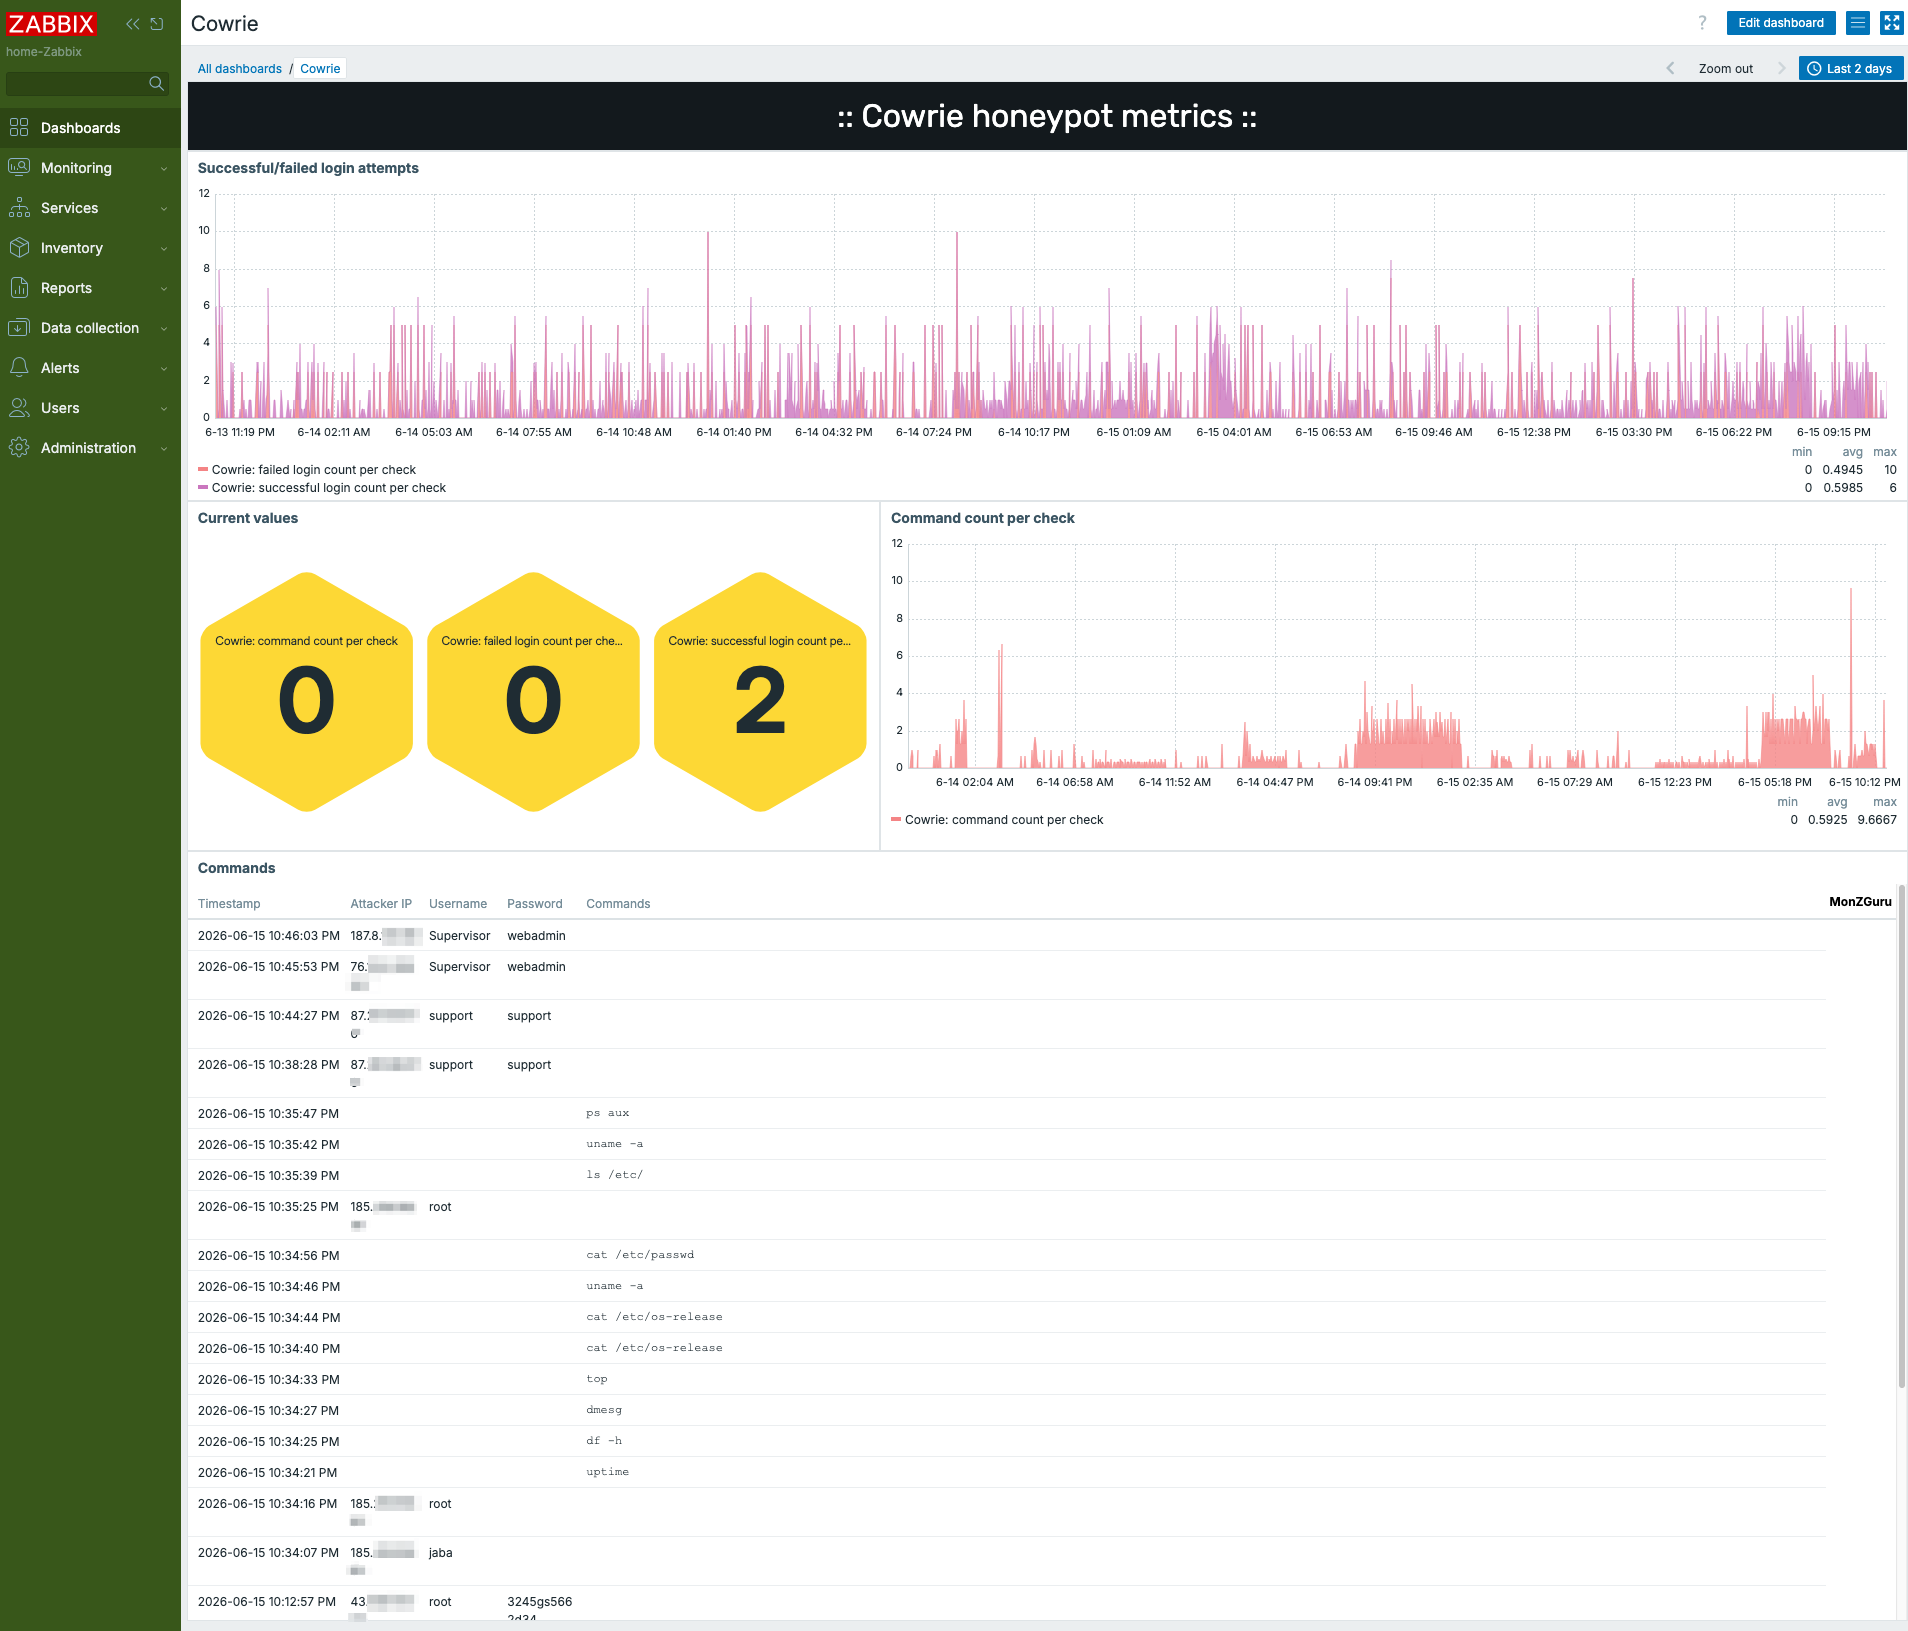
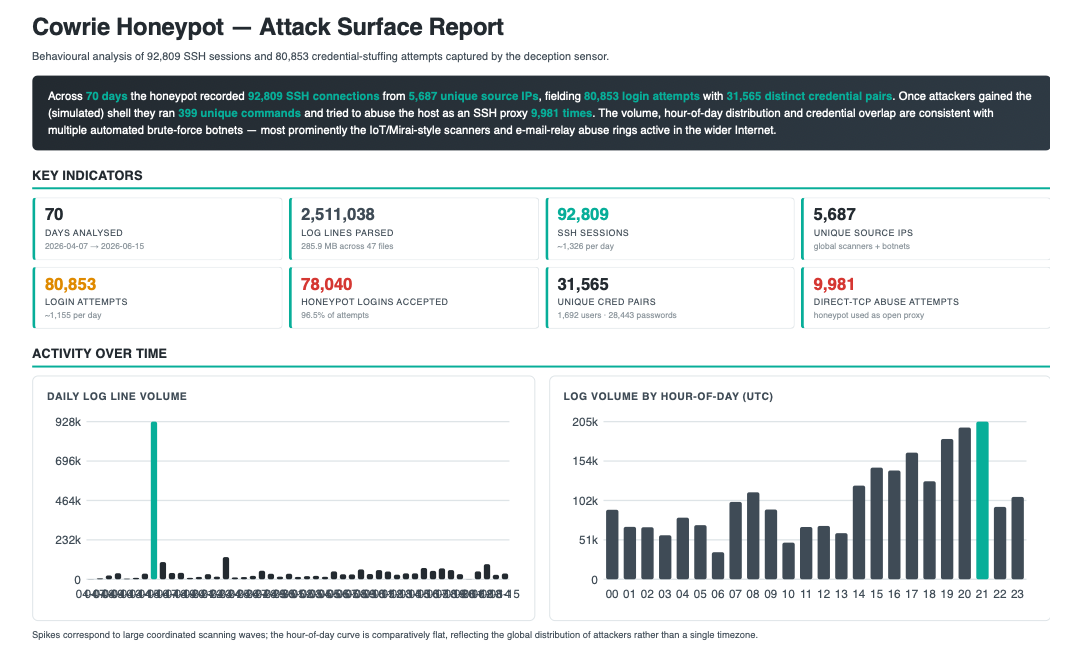
All this sure is very educational. Whether monitoring something like this excites me or makes me absolutely terrified, I don't know. It gets even scarier -- or more useful -- if you feed these logs to LLM of your choice and ask it to produce a report for you. Here's a very short snippet of such thing: