
Welcome to my weekly blog about how I monitor my home with Zabbix. Like Batman, I have a casual day job as a monitoring tech lead, and by night I tinker around with my home Zabbix. (Except that Batman does not do monitoring, or who knows)
Anyone using Zabbix knows how it can gather data from just about anywhere, and it can send it out its alerts to just about anything -- pager systems like PagerDuty or OpsGenie, ticketing systems like Jira, e-mail, SMS .. integrating with those takes minutes, is officially supported, very well documented, and would not make sense at home. But, what if at home I would like to show any possible alerts in a completely different way?
Zabbix, meet Star Wars
So, if I want to integrate my Zabbix with a screen saver, how would that work? And how long would that take? Is it even possible?
My friend, in case of the good old xscreensaver you have many, many options. For its text-based screen saver modules you can feed it a text file, or an URL from where it downloads the text to show on screen. Making xscreensaver contents dynamic is easy.
For Zabbix, to make it send its alerts as text, you have many options. At least:
- Configure an action which runs whatever command to save the alert to text file; even echo would do
- Let your Other System to fetch the alerts over Zabbix API
- Let your Other System to fetch the alerts directly from Zabbix database
- Send out your alerts as e-mails and let your Other System to parse those e-mails
- Configure a new custom media type to do something
- Use Zabbix real-time export functionality
Internals of my xscreensaver showcase
For this exercise, I decided to use 6) Zabbix real-time export functionality.
What's that, you ask?
It makes Zabbix to save history, trends and/or triggers to JSON files, which any 3rd party program can then parse and utilise. Enabling it happens in practise by commenting out three lines in Zabbix server config file, altering the path where you want the JSON files to be created, deciding the maximum size of the created files, and what kind of events you want to export. Restart Zabbix server process, done.
My Zabbix is now running on Raspberry Pi 4. Then, I have a FreeBSD laptop for anything nerdy I want to do, and the FreeBSD laptop has xscreensaver for this demonstration.
So, my FreeBSD laptop does rsync the JSON files from Zabbix server every minute, extracts the event host name and trigger name using jq, and saves the output to text file. Surround that with header and footer text files, and you are done.
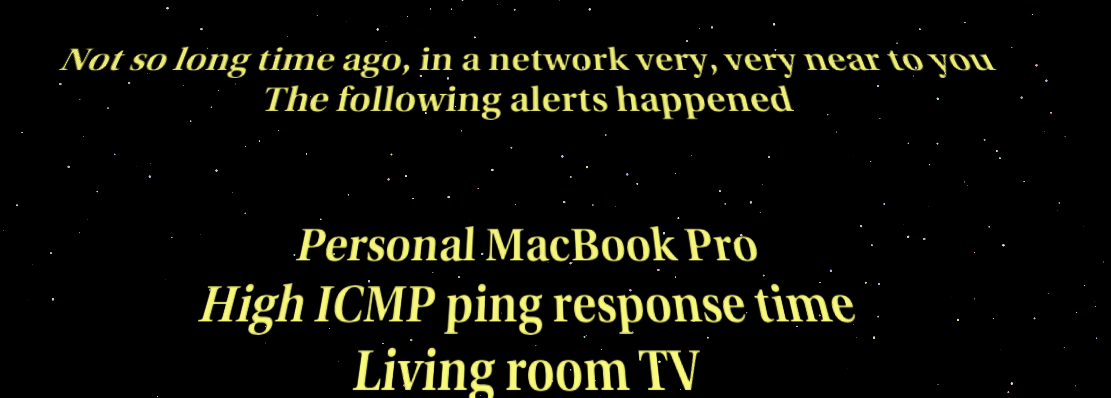
Now every time I don't touch my FreeBSD laptop in a while, it turns on its screensaver and shows me the recent Zabbix alerts. Zabbix, meet Star Wars.

For now the alert format shown on scroller is not perfect, but it works, and took three or four lines of bash in total to accomplish. That's easy, and in total took maybe 15 minutes to implement to its current stage.
Other news about my home monitoring project
- My facial cream usage monitoring is going great! I have not missed applying my facial cream even once -- I mean, I have received alerts from Zabbix, but each and every time I have then proceeded to apply the cream and my wife has received zero alerts so far. Good boy, me!
- As the trains stopping at our station are not always reliable (they can be either very late or cancelled), I now have a live map showing the real-time status of the trains we are interested about. This part actually does not have anything to do with Zabbix at the moment, it's Grafana and its GraphQL plugin querying data from an official train traffic open data system.
- Zabbix 6.0 gained a new official weather template, so I now have a local weather dashboard as well provided by Zabbix.
- I made a "home status shown as emojis" dashboard to make monitoring fun(?) and interesting(?) for the whole family -- now our home status can be observed from our living room TV easily.
Some screenshots below.


I have been working at Forcepoint since 2014 and never get bored of showing the alerts in new ways.
Add new comment