
By day, I monitor a global cyber security company for a living. By night, I monitor my home with Zabbix and Grafana. In this weekly blog series I'm sharing my weird experiments and new ideas how to utilise monitoring.
As on Easter we were not at home but doing Easter stuff, this week I have not implemented any major functionality to my home monitoring environment. But while I'm brewing new weird features, here's some bits and pieces of what I have learned about my home, and not shown here earlier.
I'm watching you, TV
We have one of those 'smart' TVs, just like about every recent TV happens to be. The one we have is some Samsung 2021 model. And, of course I monitor it.

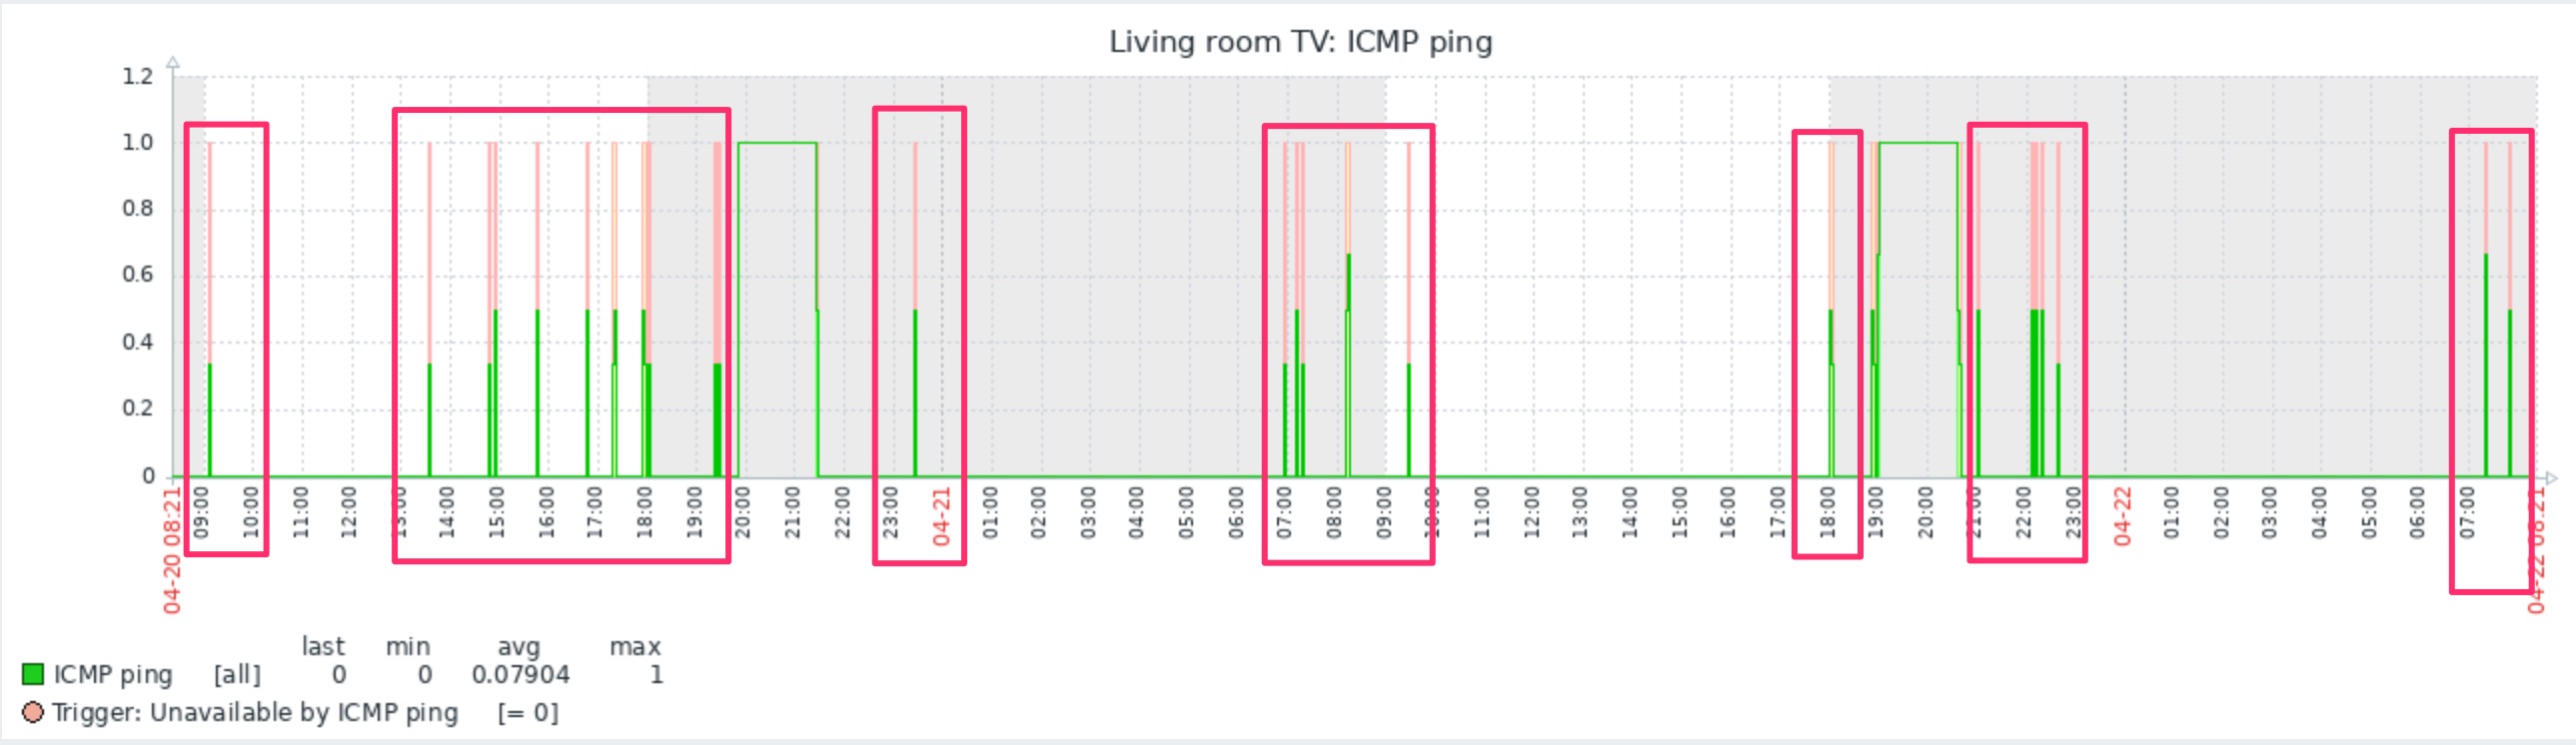
On the last two days graph above, value 1.0 means that our TV is awake and responding to ICMP ping. During the annotated short spikes the TV does not have its screen on, but it is just silently awake and doing something with the network -- maybe checking for firmware updates or sending telemetry? Anyway it is definitely doing that many times per day. I will need to snoop more closely what the heck it is doing.
A longer period of responding to ping indicates that we are actually watching the TV (or me playing PS5).
Garage, or not to garage?
Now that the spring is finally here, we were doing some spring cleaning here at home; no need for heavy winter jackets to be in our hallway closet anymore and so forth. For some items, my wife wondered what would be the humidity percentage in our garage.
Zabbix & Grafana to the rescue! The graph below shows the humidity levels of our living room and garage.

So, our garage definitely is a more humid place, and for now some humidity sensitive items were left inside our house instead of the garage.
Don't get lost, get a map
This part is very much work in progress and is lacking majority of the IoT devices we have, but I am also building a visual network map of my home environment. The map below uses the traditional Zabbix network map, but if I manage to pull a rabbit or two out of my hat, during the upcoming weeks you will see something Completely Else. Stay tuned!

Next week I will show you a definitely very weird target to monitor if I just manage to figure out how to do it.
There's an app for that
But what if I am not at home? Sure, for any serious situations like a freezer temperature rapidly rising my Zabbix will e-mail me, but what if I just want to browse around? Using the web interface via iPhone could be done but is definitely not very convenient, so I am using ZBX Viewer app for iPhone instead. It's handy, it's free and it works.

I have been working at Forcepoint since 2014 and never get bored of staying up to date about the status of my house.
Add new comment